
October 11, 2026 | by Monica, SunAuraura Machinery Process Engineering
If you ask a plant manager “how well is your packaging line running?” you’ll usually get a vague answer: “pretty well,” “about 80%,” or “we hit target most days.” But “pretty well” isn’t a number you can improve. OEE — Overall Equipment Effectiveness — is the standard manufacturing metric that turns that vague answer into a precise, actionable score. It’s the single number that tells you how much of your packaging line’s theoretical capacity you’re actually using.
After measuring and improving OEE on packaging lines for customers in 30+ countries, we’ve put together the practical guide we wish every production manager had. This isn’t a textbook OEE lecture — it’s how to calculate it on your packaging line, what the numbers mean, and where the hidden capacity usually is.
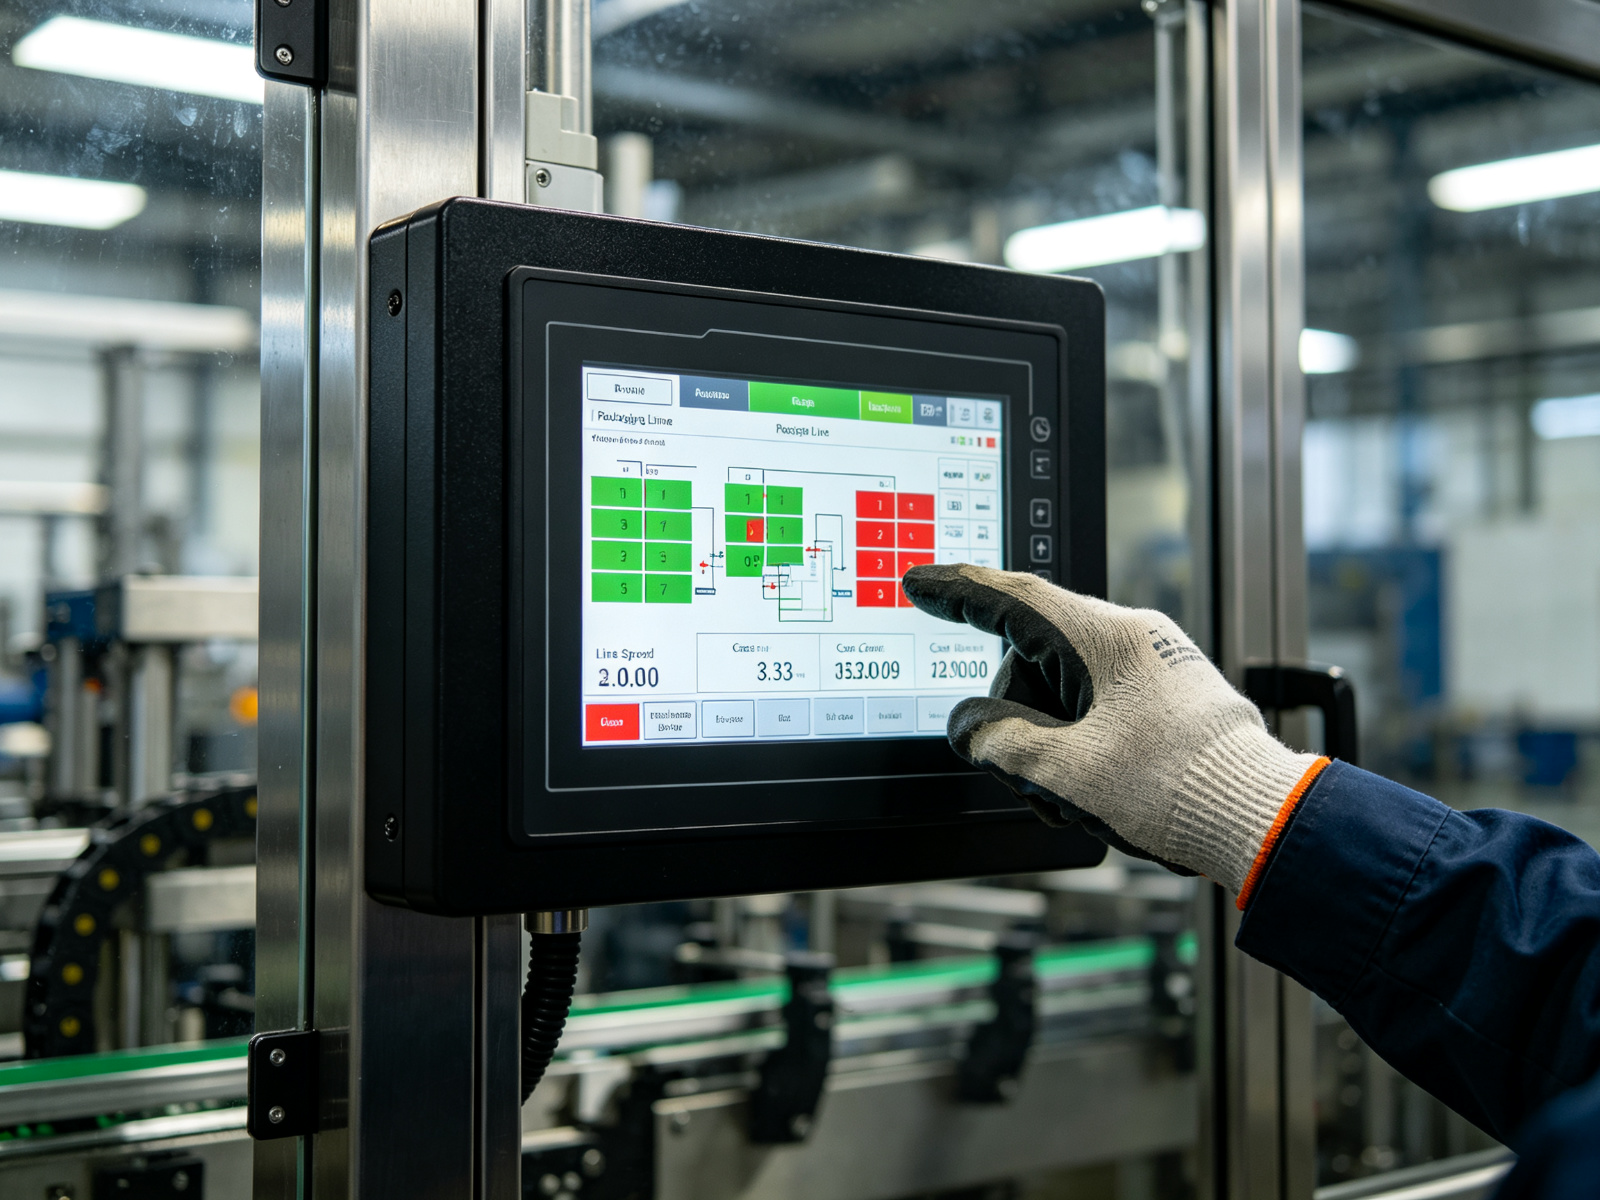
The availability and quality terms in this guide apply directly to the machines on the line — including the recently delivered automatic strapping line, where the strapper cycle time is one of the OEE availability inputs.
The OEE Formula: Three Numbers Multiplied Together
OEE is the product of three independent factors:
OEE = Availability × Performance × Quality
Each factor is a percentage from 0–100%. Multiply them together and you get your OEE score. World-class manufacturing is 85%+. The average food packaging line runs at 55–65%. Most lines we audit are somewhere between those two numbers.
1. Availability: Is the line running when it should be?
Availability measures how much of your planned production time the line is actually running. It’s the most impactful factor — even a small improvement in downtime reduction moves the needle more than speed or quality.
Availability = Run Time ÷ Planned Production Time
For a packaging line, planned production time is your shift length minus planned stops (breaks, scheduled maintenance, planned changeovers). Run time is what’s left after unplanned stops (machine breakdowns, material jams, film roll changes that take longer than expected, waiting for product).
Example: An 8-hour shift = 480 minutes. Planned breaks = 30 minutes. Planned production time = 450 minutes. Unplanned stops (breakdowns, jams, film splices) = 90 minutes. Run time = 360 minutes. Availability = 360 ÷ 450 = 80%.
2. Performance: Is the line running at its rated speed?
Performance measures how fast the line runs while it’s actually running. A packaging line that’s rated for 60 packs/minute but actually runs at 48 packs/minute due to small stops, minor jams, and slow acceleration has a performance score of 80%.
Performance = (Ideal Cycle Time × Total Pieces) ÷ Run Time
The biggest performance killer on packaging lines isn’t the big stops — it’s the micro-stops: a jammed bag that takes 10 seconds to clear, a film splice that pauses the line, a sensor that needs to be repositioned. Each one is tiny, but they add up. We’ve seen lines that lose 15–20% performance to micro-stops that nobody was tracking.
3. Quality: Are you making good product?
Quality measures what percentage of output meets specification on the first pass — no rejects, no rework, no underweight bags.
Quality = Good Pieces ÷ Total Pieces
For a packaging line, quality losses come from: seal failures, misregistered prints, underweight or overweight bags, damaged product during wrapping, and test bags during changeover. A line that produces 10,000 bags with 200 rejects has a quality score of 98%.
Worked Example: Your Typical Packaging Line
Let’s put it together with realistic numbers:
| Factor | Calculation | Score |
|---|---|---|
| Availability | 360 min run ÷ 450 min planned | 80.0% |
| Performance | (1.67 s/pc × 7,200 pcs) ÷ 360 min | 82.2% |
| Quality | 7,056 good ÷ 7,200 total | 98.0% |
| OEE | 0.80 × 0.822 × 0.98 | 64.4% |
A 64.4% OEE is typical for a mid-size food packaging line. It means you’re getting about 64 cents of good product for every dollar of theoretical capacity. World-class is 85%+. The gap between 64% and 85% is capacity you already paid for — you just need to find it.

Where the Hidden Capacity Usually Is
When we audit a packaging line’s OEE, the biggest losses are almost always in the same order:
#1: Changeover time (Availability)
If your line changes over 3–5 times per shift and each changeover takes 45 minutes, that’s 2–4 hours of lost production per day. This is the single biggest OEE improvement opportunity for most multi-SKU lines. See our guide on reducing changeover waste.
#2: Micro-stops and small jams (Performance)
These are the stops that operators clear in 30 seconds and forget about. But 20 micro-stops per shift at 30 seconds each = 10 minutes of lost run time, plus the time it takes the line to get back up to speed. Solving micro-stops usually means better training, tighter film tension, or better sensors.
#3: Seal rejects and film waste (Quality)
A 2% reject rate sounds small, but on a 60 bags/minute line running 8 hours, that’s 576 wasted bags per shift. Most seal rejects come from temperature drift on the sealing jaws — fix the temperature control and quality jumps to 99%+.
How to Start Measuring OEE on Your Line
You don’t need an expensive OEE software system to start. Here’s the minimum manual approach:
- Pick one line, one shift, one week. Don’t try to measure everything at once.
- Start a downtime log. Have the operator note every stop over 5 minutes, why it happened, and how long it took. A clipboard and a pen works for the first week.
- Count total output and rejects. At the end of each shift, write down: total bags produced, rejected bags, and how long the line was actually running.
- Calculate the three factors using the formulas above. Do it by hand for one week — the exercise of collecting the data is more valuable than the software.
- Find the biggest loss and attack it first. Don’t spread your improvement effort across all three factors.
Most packaging line HMIs now track run time, output and rejects automatically. If your machine has a servo-driven HMI (like our flow wrappers and filling machines), the OEE data is already there — you just need to look at it.
Want a free OEE assessment of your packaging line? Send us your current shift length, downtime log, and reject rate through the contact page. We’ll calculate your OEE and identify the biggest improvement opportunity — no obligation. If you’re specifying a new packaging line, ask us about built-in OEE tracking on the HMI. See also our preventive maintenance checklist and line layout guide.
The bottom line: OEE isn’t a corporate metric. It’s a tool that tells you where your capacity is leaking. Most packaging lines have 15–20% hidden capacity they’re not using — capacity that costs nothing to recover once you find it.